
Harnessing Machine Learning for Spatio-Temporal Classification of Satellite Images: A Case Study of Vegetation Distribution Surrounding the Universitas Islam Indonesia
Achmad Fauzan*, Dina Tri Utari1, Hannura Adriana1, Alifia Tanza1
Department of Statistics, Faculty of Mathematics and Natural Sciences, Universitas Islam Indonesia
*Email: [email protected]
Background
Satellite images provide valuable information about the Earth’s surface aspects, such as land use/cover, environmental conditions, and changes over time. However, accurately interpreting and extracting meaningful information from these images can be challenging due to their complex and dynamic nature. Machine learning techniques have shown great potential in analyzing and modeling spatially and temporally variable data, including satellite imagery. These algorithms can capture spatial, temporal, and spatio-temporal dependencies through automatic feature representation learning. By leveraging machine learning algorithms, researchers can develop models that can effectively classify and predict various features and phenomena in satellite images. In this study, we focus on classifying geospatial data from satellite imagery using a machine learning approach, such as Support Vector Machine, Naive Bayes, and Decision Tree, on the vegetation objects around UII.
Methodology
The stages of the research carried out are as follows.
- Data collection via the Google Earth Engine (https://earthengine.google.com/).The data used later is satellite image data from Sentinel-2A with a spatial resolution of 10 meters, which is then cropped.
- Cutting using a polygon area directly adjacent to Umbulmartani Village by digitizing vegetation and non-vegetation around UII.
- Create training and testing data samples from the results of digitization.
Perform classification analysis and do iterations. Five variables are used in this study: independent variables are UTM easting, UTM northing, band eight, band four, and dependent variable is the label (vegetation and non-vegetation).
Result
The first stage is pre-processing. At this stage, data will be cut based on the area to be used. Figure 1. is raster data of band four and eight used in the analysis.
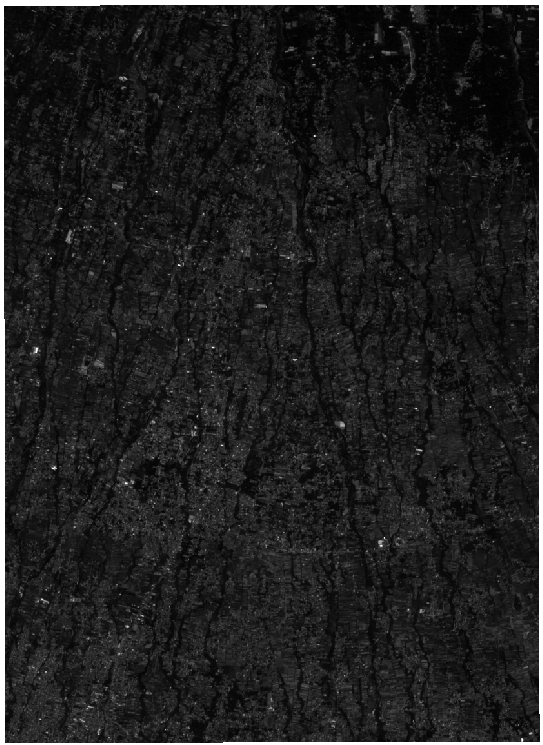
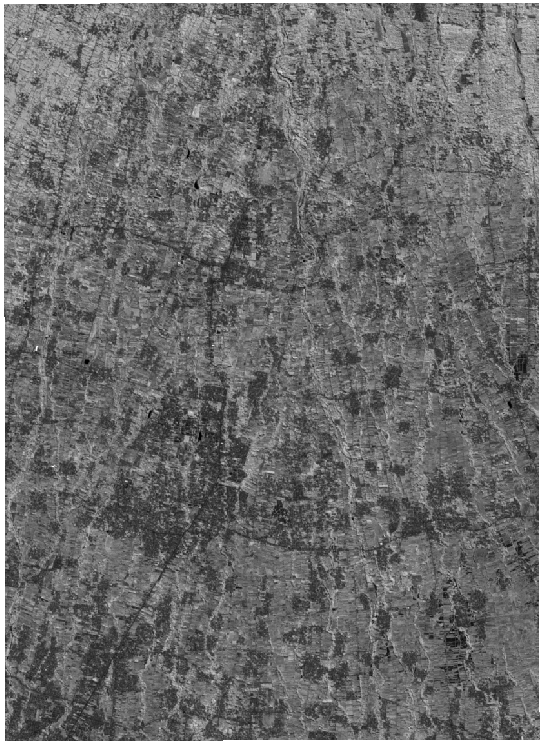
Figure 1. Raster Data of Band 4 dan 8
In raster of band four, it looks like a black image, and raster band eight looks like gray because band 4 has a wavelength of 665nm, while raster band 8 has a wavelength of 842 nm. Wavelengths with this range are included in the wavelengths of visible light, which are sensitive to the eye’s retina, but not all are visible to the human sense of sight.
To create training and testing data, we generate 1000 random points from the non-vegetation digitization results and 1000 random points from the vegetation digitization results. The non-vegetation data will be labeled with 0 and the vegetation with 1. We use 80% of the data for training purposes and the rest for testing.
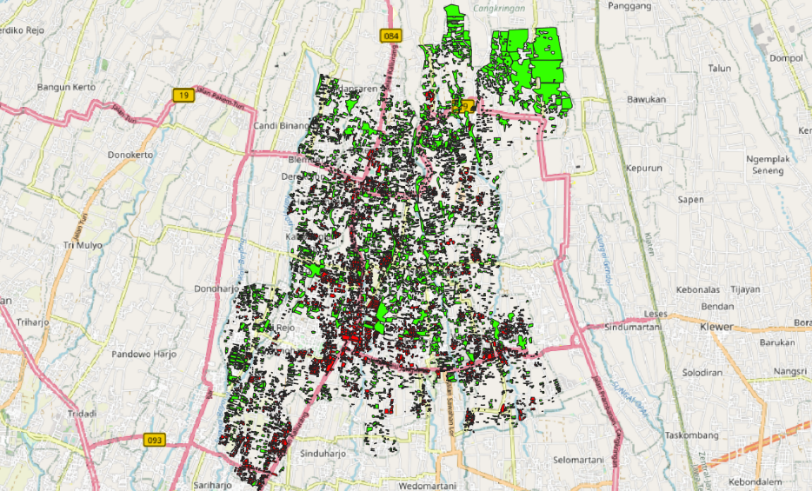
Figure 2. Vegatation and Non-vegetation From Digitation
According to Figure 2., the red colour represents non-vegetation, and the green colour represents vegetation.
Furthermore, the classification of vegetation and non-vegetation areas is carried out based on related variables. The best method is the Naïve Bayes method based on the average difference between training and testing data at an accuracy value of 0.12. In contrast, the Support Vector Machine method has a difference of 0.16, and the Decision Tree method has a difference of 0.68. An illustration of the dataset prediction results is presented in Figure 3.
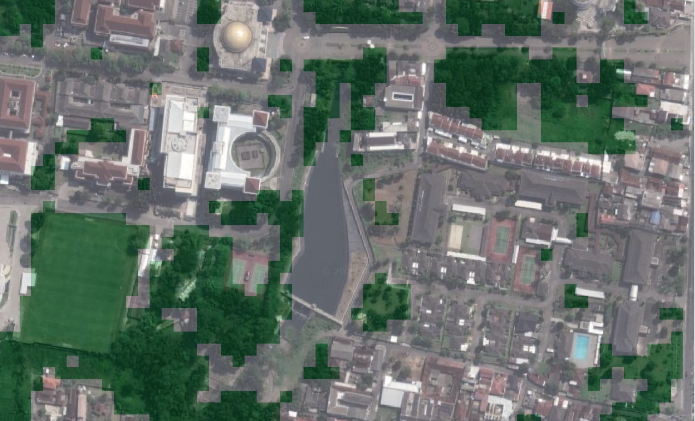
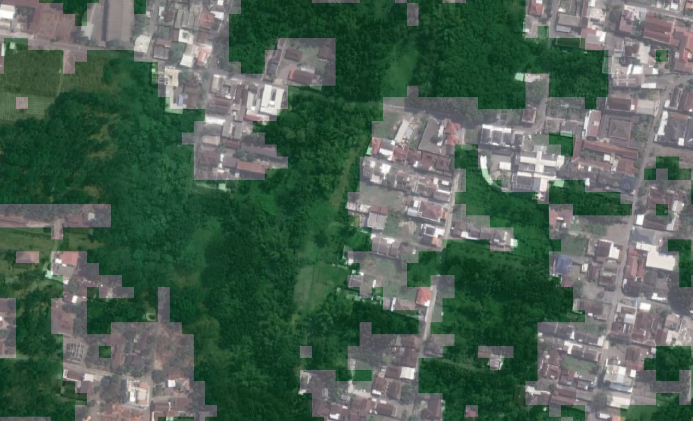 Figure 3. Visualization of 2023 Dataset Prediction Results
Figure 3 shows the visualization of the dataset prediction in 2023. Green areas are categorized as vegetation objects, while white areas are non-vegetation objects. From Figure 3, it appears that the prediction is in accordance with the actual data. The accuracy value of training data on the identification of vegetation and non-vegetation in areas directly adjacent to UII in 2019 to 2023 using Naïve Bayes is 94%, 93.75%, 92.31%, 90.12%, and 92.19% consecutively while the accuracy value on testing data is 95.25%, 93%, 91.25%, 91.5%, and 94%. Based on the results obtained, from year to year the percentage of vegetation around UII has decreased to 2% of the entire area observed.
Recomendation
When viewed from the aspect of one time, the research results obtained the development of the proportion of vegetation areas from a significant decrease based on the radius between 0.5 to 7 km, which means that the closer to the UII Ulil Albab Mosque, the less vegetation land, on the contrary, the farther to the UII Ulil Albab Mosque, the more vegetation land. Meanwhile, when viewed from the aspect of more than multi-time, the year 2023 has less vegetation land than previous years. Therefore, the more years increase, the more development around UII. Based on this phenomenon, a more patterned development pattern can be considered so as not to damage other resources.
Acknowledgement
The authors would like to thank Badan Perencanaan dan Pengembangan/Rumah Gagasan Universitas Islam Indonesia for their valuable support.